Calculating Projected Subscription Revenue
In subscription-based businesses, one of the most powerful insights comes from a surprisingly simple approximation: you can estimate the total revenue generated by a cohort of subscribers by dividing the monthly recurring revenue by the monthly churn rate. This idea is essentially an intuitive way to approximate the area under a subscriber revenue curve, and it provides a fast, practical method for projecting revenue without building overly complex models.
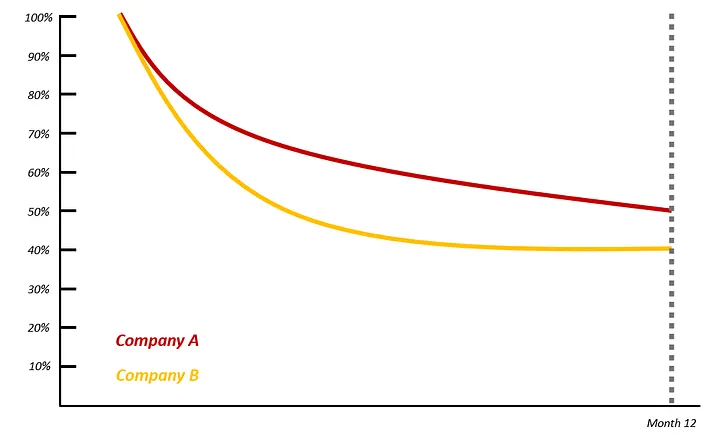
To understand why this works, it helps to think visually. Imagine a curve that represents revenue from a fixed group of subscribers over time. At the start, revenue is high because all subscribers are active. Each month, some percentage of subscribers churn—meaning they cancel or stop paying. As a result, revenue gradually declines. If churn is relatively stable, this decline resembles a smooth, downward-sloping curve. The total revenue you earn from that group is the area under that curve.
Mathematically, this situation behaves much like an exponential decay process. Each month, a fixed percentage of subscribers is lost, so revenue shrinks proportionally. Calculating the exact area under this curve requires calculus or a detailed month-by-month projection. But in practice, you can approximate the total value very efficiently using a simple ratio: monthly revenue divided by monthly churn rate.
Here’s the intuition. If your monthly churn rate is 5%, that means, on average, a subscriber lasts about 1 / 0.05 = 20 months. This isn’t a precise lifetime for every subscriber, but it is a statistically meaningful average across a large population. If each subscriber pays a fixed amount per month, then their expected lifetime revenue is roughly monthly revenue multiplied by average lifetime. That is exactly what dividing by churn accomplishes. Monthly revenue ÷ churn ≈ total expected revenue.
For example, suppose a subscription business generates $100,000 in monthly recurring revenue from a cohort of subscribers, and the monthly churn rate is 4%. Dividing $100,000 by 0.04 yields $2.5 million. This figure approximates the total revenue that cohort will generate over its remaining life. While this ignores seasonality, price changes, and cohort-specific behavior, it is often accurate enough for strategic decision-making.
This approximation is especially useful because it connects directly to how subscription businesses actually operate. Churn is one of the most stable and revealing metrics in recurring revenue models. Small improvements in churn produce outsized gains in lifetime value. For instance, reducing churn from 5% to 4% doesn’t just improve retention slightly—it increases average lifetime from 20 months to 25 months, a 25% increase in total revenue per subscriber. That leverage is immediately visible when using this formula.
From a modeling perspective, this approach is far superior to “hard-coding” multi-year revenue assumptions without grounding them in behavior. Instead of guessing how long customers will stay, you let observed churn rates do the work. The formula forces discipline: if projected revenue looks unrealistic, it usually means churn assumptions are unrealistic. This makes the approximation an excellent reality check for forecasts, valuations, and customer acquisition decisions.
It’s also worth noting the limits. This method assumes churn is relatively constant, pricing is stable, and there is no expansion revenue from existing customers. In businesses with strong upsells or usage-based pricing, the true area under the curve may be larger. Still, as a first-order approximation, the churn-based method is remarkably effective.
In the end, dividing monthly revenue by monthly churn rate is not just a shortcut—it’s a way of thinking. It reinforces the idea that retention is revenue. By focusing on churn, businesses gain a clear, intuitive handle on lifetime value, growth efficiency, and the long-term economics that ultimately determine success.
Recent Comments